What
a dramatic last three trading days to close the first half of the
year on a high note! S&P500 is up 8.3% for the first half, or
over 16% annually - which by any measure is a great result - double
the historical growth rate. Stock prices have been steadily ascending
since October 2011, boosted by a whiff of hopeful recovery in the
U.S economy, a seemingly claim state amidst the sovereign-debt storm
in the E.U., merrily cheered on by central bankers with near-zero
interest rate and hoping for further easing.
Here
is an oxymoron: The job of an investor or money manager is not to
make money but to manage risk because once you take care of the risk,
you take care of the rest. One of the most important job in managing
risk is to measure the temperature of the economy and know where we
stand. At the moment, it is unwise to be fully invested unless one
can find something that is totally uncorrelated to the market.
However, even in a expensive market, there're still value buys on a
bottom-up basis because the market is never fully efficient – just
a matter of degree.
If
you are an individual in debt, what would you do to solve your debt
problem? Would you take on more debt to pay your old debt? No, you would not. Would taking on more debt to pay your old debt solve your problem? No, it does not. The only way to solve
your problem is to cut your expenses and pay down your debt. Or you
can chose to default and break your obligations which were granted on
the basis of trust in your ability and goodwill to repay the loans.
Essentially, those people in debt need to stop spending money that
they do not have. So why should it be any different for a sovereign
country? The solution to too much debt is not more debt.
Sooner or later, something have to give and people start facing the
ugly truth. The highly-in-debt country may just chose to default on
its obligations, either directly or indirectly. By indirect manner, a
country can print more paper currency to pay the interest which makes
the currency worth-less if the debt are issued in their own currency.
A direct or outright default happens when a country simply stop
making payments for their obligations – and there's no recourse to
claiming from a sovereign country: you can sue a company for
defaulting and claim its assets in court but for a sovereign country,
how do you sue for a country's assets? Bill Gross and Jim Rogers are
two proponents who question the solution of using more debt to solve
a debt problem. All these look like a band-aid solution for which
every time the policy makers gave such a solution, the market jumps
on the hope of it being a panacea but after a while, real questions
set in and bring the market to where it was before. How many times
have this type of scenario been played over the past year or so?
Here
are some recent quotes from Bill Gross:
- “Lots of money being printed but very little wealth. Wealth comes from innovation and elbow grease not higher asset prices.”
- “Don’t be fooled, central bank credit creation increases asset prices but it doesn’t create wealth.”
- “Wealth’s not cre8(a)d w(ith) high(e)r asset prices but w(ith) productiv(i)ty;labor;innovati(o)n. High(e)r asset prices due 2(to) lo(w) inter(e)st rates (a)r(e) fi(ct)ktitIio)us wealth.”
So
the question is what should we do now?
In
an up-market, some investors for “fear” of losing out may be
lulled into pumping more cash into equities. But in an expensive
market (top-down), there's a dearth of compelling cheap businesses
(bottom-up). So is the market now cheap , a value trap, or just
expensive? There are two ways that tells two different stories on the
same topic. By the traditional value method, a snapshot of the S&P500
shows a current multiple of 15x (based on trailing 12-months
earnings), which is not overly expensive in historical terms. But the
Shiller PE which is based on a 10-year moving average of earnings to
smooth out the impact of an economic cycle, shows an expensive
historical 24x.
So
why did the two measures differ so much apart? In a March 2012
article by James Montier of GMO, he noted a compelling point: The two
PE measures are derived from different time perspective. Profit
margins are an important determinant of earnings and Montier gave
mathematical evidence that the divergence of the two measures lie in
the result of profit margins deviating from their long-term normals.
That is to say, profit margin today is at historical high for U.S.
Corporates. In fact, it is abnormally high, hovering almost 2% points
over the last peak since 1952, according to NIPA Flow of Funds data.
Such a margin is unprecedented and has caused earnings to go through the roof, or perhaps “artificially” high. Some of the
margin improvements are achieved through synergy, cost cutting, labor
cost, etc. And there is so much you can do to cut your way to
prosperity. Not only is corporate profits at the highest ever, but wages as a percentage of GDP is at the lowest ever since post-war.

As an example, a small compression in margins can cause a big distortion to stock price, particularly if you purchase at the peak. Nike, which just reported earnings, is off almost 10% for the day when they reported a lower margin (not a lot lower but about 2% lower in gross margin). For those who bought at the peak of $115 thinking that margin cannot be compressed, and extrapolated from the recent past, this is a toxic cocktail. So they learn the old lesson the old way, through their wallets and is down almost 25% in less than three months.
Another
broad measure is taking the total market value as a percentage of
Gross Domestic Product. The broadest index to use is the Wilshire
5000. Using this index, the total market value of Wilshire 5000 as a
percentage of GDP is 106% as at June 30, 2012. There're two ways to
look at it again: if you compare since 1950s, 106% falls on the high
end of the spectrum; but if your vision is tunneled to just the
recent past since 1995, this is on the low end. But extrapolating
from recent past can kill you. The market has historically been
priced at 60-80% of GDP, it is only in recent past, particularly from
the 1995, did the percentage top 90% and above, peaking at over 170%
in March 2000. Here's a graph that speaks a thousand words.

World
Bank also compile their own data. You can find the data in this link:
http://data.worldbank.org/indicator/CM.MKT.LCAP.GD.ZS?page=4.

Unfortunately,
World Bank only have data from 1988 onwards but the trajectory,
whether World Bank or the first graph, are the same. Both also shows
clearly the difference in valuation 1) before 1995 and 2) after 1995.
The year 1995 was the first time in financial history that the U.S
has seen its total market value as a percentage of GDP touches 90%
and ever since, it has averaged well above 90%, except in 2009 when
it fell below 80% just for a moment, and stayed over 90% since. Now
some people may have gotten used to it and argue that 100% is on the
low end of the spectrum for the last 20 years and therefore, the
market is reasonable. Well, only time will tell who is right. For us,
we rather err on the side of caution than to be recklessly bold.
By
locking up the bulk of assets or capital in equities right now is
likely to doom your portfolio to a long-term return rate that is
historically unattractive and that grossly under-compensates you for
the risks assumed. More importantly, having limited cash at a time
when you should be having more means forgoing future opportunities
that are likely to be better than today's. And in a distressed
market, by selling stocks in order to buy other distressed stocks is
no bargain if your stocks are also in distress. The bargain comes
only if you have liquidity at the right time which holds water and
can be used to buy someone else's perceived trash (treasure to the
buyer), and exchange the cash, which in fact is trash at that time
but perceived as treasure by someone else. During the market low of
2009, sellers perceived their stocks as trash (treasure to the buyer)
and sold it in return for cash which they perceived as treasure
(trash to the buyer). The right thing to do then was the other way
round. We have seen this scenario played over and over again.
To
get good return and yet low risk, the best time to be fully invested is when market
is in great turmoil. At this point, potential return far outweigh the
risk assumed. This should be the hallmark of a prudent investor or
money manager. To join the rat-race chasing for return together with
your peers for fear of losing out or for the reason of looking bad is
not prudential. When we start to compare ourselves against peers or
even indices and only focus on comparing, it is easy to get lull into
operating on a relative basis rather than absolute one. Instead, we
must only focus on things that are truly important, especially risk
management. In investing, the only way to make money is absolute, not
relative – as they say “you cannot eat relative.” Perhaps some
people may feel good even if they lose money as long as they lose
less than the market. When they make 50%, you may think they are
delighted but for investors who get lost in relative performance,
they are not. They are likely to feel very terrible. Now, you may
think how can someone who makes 50% feels terrible? Lo and behold,
these relative investors are happy with 50% until they see the market
making 55%.
So
as an investor, you got to decide what you want to be. For us, we
focus on absolute return. To do so, we
follow our core principles as follows:
- We work on patience and maintain discipline by not chasing for return that does not sufficiently compensate for the risk we take - even if our portfolio lags behind the market in the short to medium run.
- We focus on doing what we think are the right things even if it looks wrong in the eyes of others, and not what looks right or relative.
- We do not look to beat the market all the time. We only look to beat the market at the right time, particularly, we aim to significantly outperform the market on a downturn and hope to maintain with, or even underperform the market on an upswing.
- We are dedicated to measuring our performance on a full economic cycle (i.e., a long market cycle that goes through thick and thin) against the market benchmark.
- We do not allow others to tell us what to buy, what to sell, when to buy or when to sell, especially on a baseless manner. Although we pay attention to what they say because it gives us an inkling what the market is doing and if what they are doing is sensible or not, and we position ourselves accordingly.
- We make our own decisions on how we think about the business and the value that is expected from the price we pay or sell. We eat our own cooking. Others who tell us what to do usually do not eat the cooking with us.
- We do not rely on others to measure our performance, we evaluate ourselves by what we say we will do in our core beliefs that will bring us long term performance excellence on an absolute basis.
You may ask what are the right things. It is impossible to clearly lay it all out. We can only say we know it when we see it - just like Judge Potter Stewart when explaining what is hard-core pornography, said: "I know it when I see it."
Armed
with the above, we, as investors, are at the crossroad facing a
fundamental choice on how to reach the final destination – do we go
slow or do we sprint? The first thing to recognize is investing is
akin to running a marathon. If you sprint, you may get ahead of
others at first, but losses your steam pretty darn fast. Thus, pacing
oneself is crucial. Remember, the Aesop's fable, “The tortoise and
the hare,” is just as applicable today as it was back then. And
today is one of those days you do not sprint, instead, keep your
breath and energy, and watch others sprint until they cannot. And
heaven forbids, you might even want to egg others on to sprint.
Despite
all the dramas, many of which unresolved, investors have hardly
balked even as we live in a more interdependent world. There are more
challenges to come in the second half including the “fiscal cliff”
issue. Eventually, something have to give and a band-aid solution
would work no longer. When the day of reckoning arrives, policy
makers can be counted on to do the right thing eventually. But it
will not be good for the securities market in general. That is when
we will be absolutely optimistic for the future: We are neither a
perma-bear nor a perma-bull. It depends on where we are in the
economy. Meanwhile, it is never fun waiting for the time to arrive,
and it is certainly not fun to be fully-invested when the day of
reckoning comes, but it is certainly fun when the day arrives,
provided you have bullets to shoot, so to speak. What dooms a man is
his failure to sit quietly in a room as Blaise Pascal observed all
along, and we are determined not to be such a man.
As
of 30 June 2012, cash as a percentage of assets is about 28% of total
assets, down from 32% at the start of year. We are very reluctant to
go much below this threshold based on current market conditions
unless we can find something really valuable. As we write, we managed
to increase by 4% in cash on the last trading day of the first half.
We will divest more stocks into cash if the market gets more
expensive, hopefully, it will. We are cheering for it although we
have the capacity to allocate into stocks, but we are net-seller in
this market.
Although
we hold a reasonable amount of cash, we have outperformed the major
U.S indices but underperformed the Singapore index. We did not deliberately aim to outperform in this market but our positions generated the returns that allows it to. In an
expensive market, we are satisfied to keep up with, or even
underperform, the market. It is in an upheaval market that provides
us with the best chance to outperform significantly in the safest
manner. In the game of investing, we wait for others to commit
unforced errors. We do not claim to have any special or better skills
than any other market participants. Charles Ellis, long ago,
described this phenomenon in his article, “The Loser's Game:” In
the game of investing, it has long ago turned into a game where folks
with ordinary intelligence can win as long as they wait for others to
commit mistakes. Investing is not a value-adding activity, it is a
zero-sum game: In order for someone to make money, someone else must
make a mistake. When you buy X security, someone else must sell you X
security. In the exchange, you as a buyer think X is likely to make
you money while the one who sells you X thinks it is likely to be a
loser. Who is correct? Someone must be making a mistake, it is either
you or the seller. As they say in Poker, if you do not know who the
patsy is on the table, it is likely to be you. Another word of
caution: in investing, it is relatively simple if you focus on the
right things and keep learning but it is not an easy game. Only a
fool will think it is an easy game.
Another hardly-asked question is how did the portfolio achieve its results. Most of us tend to just focus on the headlines. For example, if you compare the following arbitrary portfolios handled by different managers:
If we are to chose which manager to hand out money to, we will hand our money to Manager B. If there are only two choices - Manager A and C - we will chose C. Over our dead body will we ever chose A.
Another hardly-asked question is how did the portfolio achieve its results. Most of us tend to just focus on the headlines. For example, if you compare the following arbitrary portfolios handled by different managers:
- Portfolio A returns 50% in first half 2012.
- Portfolio B returns 2% in first half.
- Portfolio C returns 2% in first half.
- Portfolio A 50% return was largely achieved by placing a significant portion of assets in a "hot" stock with minimal revenue and has yet to generate any earnings to show for. However, it is "hot" and much pursued after by market participants because of its perceived attractiveness with novel technological capabilities that has the "potential" to grow exponentially.
- Portfolio B is up only 2% and underperformed the major indices by 4-6% because the manager deemed the current state of affair as risky, especially with a dearth of compelling buys. He, thus, allocated, less than 50% into equities, with the rest lock in safe havens like cash or short-term treasuries, while biding for his time.
- Portfolio C underperformed at the same rate as Portfolio B. However, the results for Portfolio C was achieved very differently from B. The manager for Portfolio C is almost fully invested, with only 10% cash or less. However, most of his equities turn out to be duds and most of the securities are not in safe-haven securities like consumer staples or the stable type of stocks. Most are in cyclicals. And it returns 2% versus the major indices return of 6-8%.
If we are to chose which manager to hand out money to, we will hand our money to Manager B. If there are only two choices - Manager A and C - we will chose C. Over our dead body will we ever chose A.
To
end this segment, here is a portion of one of our favorite poems of
all time which happens to capture the essence of successful investing
– “IF” by Rudyard Kipling:
Quote
If
you can keep your head when all about you are losing theirs and
blaming it on you.
If
you can trust yourself when all men doubt you but make allowance for
their doubting too.
If
you can wait and not be tired by waiting, or being lied about, don't
deal in lies, or being hated don't give way to hating, and yet don't
look too good, nor talk too wise.
Unquote
First
half of 2012 portfolio review
Portfolio performance are shown in the following tables: Basically, we use four benchmarks to measure our long-term performance.

Portfolio performance are shown in the following tables: Basically, we use four benchmarks to measure our long-term performance.

What
have we set out to do at the outset and have we accomplished it?
- Have we been conservative in a seemingly expensive market and be brave in a seemingly chaotic one? Check. Compared to early 2009 to mid 2011 when we were fully invested, we shifted gears starting mid 2011 to more cash, peaking at 35% cash, but has since dropped but we are still rather conservative holding 28% cash. We will increase or decrease depending on how hot or cold the market is, or if we can find cheap buys even if the market is hot.
- Have we been able to resist chasing after returns for the sake of keeping up with the Jones and be satisfied to underperform in an up market and outperform in a down market which is the strategy to long-term outperformance in a full economic cycle? Check. Our portfolio has so far shown the characteristics to underperform when the market takes a huge step forward and outperform when the market takes a huge step back. And over a period of time, we have delivered results that are satisfactory, and so far been absolute. Here are some examples:
- S&P500 is currently flat from the closing of April 2011 of 1363.61 (peak for 2011), while our portfolio is up 3% while maintaining a cash level of 25 to 35% for most of the period.
- S&P500 is currently down 3.3% from the closing of April 2012 of 1408.47 (close to the peak for the first half), while our portfolio is up 1% while maintaining a healthy cash balance of 25 to 28% for the period.
- In an up market, we are likely to underperform the benchmarks but we will not be unhappy, instead we are satisfied although it may be emotionally tough but we understand our goal. For example:
- If measured from market low: From end September 2011 (market low) to now, S&P500 is up 20.4%, while we are up 14.4% while maintaining a cash level of 15 to 32%.
- If measured from the high to the low in 2011: From end April 2011 to end September 2011, S&500 is down 17% while we are down 10%.
The above examples demonstrated, thus far, that we are able to deliver satisfactory results by paying attention to risk. This is achieved by 1) outperforming the market on its way down, and 2) matching or slightly underperforming the market on its way up. We wait for unforced errors and pick up the free lunches - maybe not free but for a dime or significantly less than its intrinsic value. - Did we dig for gems regardless of market's temperature? Check. We will never throw out the baby with the bath water under any conditions. Mastercard and Visa were bought at a valuation that is likely to produce mid-teens return for the medium term even though it reduces our kitty.
- Have we exercised patience, and analyze thoroughly before buying or selling ? Need to work on. We could have been better but we take it as a learning curve. Although we had done reasonably well for most of the stocks that we sold based on what we think it is worth, there is, however, one which we committed an elementary error – Anheuser Busch Inbev. It is not because we feel terrible that the stock has surged to over $79 (we sold at $64.6) but rather for the failure to do a proper analysis when we sold and then learnt later that we left significant value on the table. We do not feel terrible just because a stock surges from the price we sold. Two other stocks that we disposed have also gone up – Starhub (sold at S$3.28) and SIA Engineering (sold at S$3.87) – but these two are likely to be, at best, fully valued. We do not see how Starhub and SIAE earnings can grow at the same pace as how the stock prices suggest, particularly, Starhub because they have run out of tax assets and need to pay tax in cash very soon, but sure, they have better levers than the other telcos which they can pull to increase debt which may benefit shareholders.
We do not expect our current outperformance to
continue if the market gets more expensive by the day. In fact, if it gets
more expensive, we are likely to underperform, probably by a large margin.
Heaven knows how long the market's ascension can last, but one thing for
sure, nothing goes in one direction forever and on a straight path,
the day will come when something -expected or unexpected – that
will knock the breath out. In fact by being more conservative, we
have managed not to lose as much back for what we had laboriously
fought for. From end of April 2011 to end September 2011, the S&P500
lost 17% while our portfolio lost 10%. But we are not as conservative
at that time than we are now. The outcome as demonstrated by the most recent
smaller slump: From end of March 2012 to the 26 June 2012 (3 days
prior to the market surge that ends the first half on a high note),
S&P500 declined by 6.3% while our portfolio declines by 1.2%.
Thankfully,
we have managed to do reasonably well even when the market is not
particularly cheap and probably risky, while able to maintain a
reasonable cash level at 28% of assets, though down from 32% cash at
the start of year. The reduction in cash can be attributed to the
purchases for Mastercard and Visa.
What
are the main drivers for the portfolio first half performance?
- Coca Cola – We took the opportunity to add KO at an average price of about $67. We would not have added more Coca Cola had Pepsico price not been within 3 to 4% percentage less than KO because we do not think it is prudent to reduce cash holding significantly for a stock that is only slightly undervalued. But compared to Pepsico, KO is a better bet if KO is selling for only 3-4% more than PEP. Therefore, to fund the purchase, we reduced our then-significant exposure to Pepsico and bought into Coke. Although, we have since reduced roughly 2/5 of KO. Today, the difference between KO and PEP is about 10%, down from 15% earlier, in favor of KO. And let's not misinterpret this as a technical play or based just on the difference in prices. Rather, it is a comparison of which stock provides a better value if the price of Coke is 3-4% more than Pepsico. At $67 for KO, it is selling at almost the same multiples with PEP at $64-$65 and KO eps growth is brighter than PEP. This was prior to PEP's reduced earnings guidance. In total KO return 14.8% for the first half, and comprised about 13% of the total gain for the portfolio.
- Mastercard and Visa – Stakes were accumulated in January 2012. Return for the two shares is 17.6% since acquisition. This group comprised about 20% of portfolio total gain.
- United Overseas Bank – Up 25.5% for the first half. Makes up 24.4% of portfolio gain. However, the performance is much less stellar if measured from cost, up only 6.6% (although if measured in SGD terms, it is up 10%) since acquisition during second half of 2011.
- Berkshire Class B – Up about 9.2% for the first half. Comprised slightly over 9% of total gain. However, it is up by only 4.3% from cost. Shares were acquired at different times, with two-thirds acquired in May 2011, and the rest acquired in Jan 2011 and earlier.
- Haw Par – Up 17% year to date. Contributed 5% of total portfolio gain.
- Pepsico – Up 6.5% for the remaining shares. However for those shares that were sold, it was sold at a lower price ($65.74) than the price at the start of the year ($66.35), therefore, it lowered the gains for the remaining Pepsi shares.
- Remaining gains came from smaller positions such as DirecTV, Reckitt Benckiser, Becton Dickinson (partially sold), CSX (sold), Anheuser Busch Inbev (sold), Amgen (sold) and some opportunistic stocks like St. Jude Medical, Starhub, SIA Engineering and Baxter which are all sold.
- Opportunistic stocks – St. Jude Medical was acquired for $32.5 in December 2011 and was sold at a gain of 10.5% the next month. Baxter was similarly bought in December 2011 at $48.11 and sold two months later for a gain of over 16.8%. SIA Engineering was acquired in January 2012 for $3.38 and sold in March for a gain of 13.3%. Starhub was bought in January 2012 and sold recently in June 2012, for a gain of 20%. These four opportunistic stocks comprised about 7% of total portfolio gain.
- The above reflects the positions with positive returns. The total return for the above positions produced a gross gain of 9.7% year to date. But this is offset by some positions with losses Net result as shown along with Dow Jones Industrial Average as a comparison:

In
case you are wondering why we did not take S&P500 which is more
broad-base and representative as a comparison: DJIA only consists of
30 stocks and is a price-weighted index. This makes it easier to
calculate than to go through the hassle for S&P500.
- Losers for first half includes:
- Norfolk Southern (-1.4%),
- Western Union (-5.4%),
- Google (-3.6%),
- Celgene (-12%),
- Tesco PLC (-2.1%),
- Singapore Land (-1.8), and
- Molson Coors (-1.6%).
69% of the losses comes from Norfolk Southern, Pepsico (related to the shares sold to fund KO), and Celgene. Of the 3 main loss contributors, we hold a larger position in Norfolk and Pepsi compared to Celgene. Unfortunately, after purchasing at $73, it fell through the roof to a low of $59, and is now $64 and change,. This is mainly because of a delay to gaining new marketing approval for extended use in the E.U for its top selling drug . But at $59 or below, we stand ready to add because we think it has a strong line of current commercial drugs and also a decent pipeline that serves to extend use for existing drugs and also new drugs in trials.
*All
performance mentioned excludes dividend.
Additions
to portfolio:
- Mastercard and Visa
Started
accumulated in January 2012 with an initial allocation of 5.7% of
total assets. Subsequently, added another 4.2% of total assets in
May 2012 when there was a small correction for both stocks. In
total, almost 10% of total assets (based on start of year total
assets) were allocated in these two equities.
Average
price paid - $369 for Mastercard and $105 for Visa. Return since acquisition –
about 17.6% as a group.
Why
Mastercard and Visa? We paid about 16x on a forward 12 months earnings for
both. Medium growth rate for both stocks range from mid to high
teens for earnings per share. Any business with a fairly predictable
revenue stream, defensible business model, growth at well over 10%,
and available for 16x earnings is likely to do well. Historical eps
growth is well above 20% since their IPOs. Foreseeable medium
growth is over 15%.
Now take Mastercard as an example and assume growth slows to 10%, earnings by 2015 would then be $27.4 per share. In order to lose money, the stock must sell below 13.5x in 2015 and growth rate must slow to 10% for us to show a loss. Of course, if such a scenario happens, we will be extremely glad to double, triple or even quadruple our stake for a business that still carries a 10% growth rate and sells for a very reasonable 13.5x earnings.
Now take Mastercard as an example and assume growth slows to 10%, earnings by 2015 would then be $27.4 per share. In order to lose money, the stock must sell below 13.5x in 2015 and growth rate must slow to 10% for us to show a loss. Of course, if such a scenario happens, we will be extremely glad to double, triple or even quadruple our stake for a business that still carries a 10% growth rate and sells for a very reasonable 13.5x earnings.
Otherwise,
in a normal path, assuming an achievable medium per-share-earnings growth of
15%, by 2015, Mastercard would earn at least $40 per share on a
forward 12-months basis. Assuming there is no compression in
multiples from what we pay, at 16x, stock sells for $640, an annual
return of 15%. If multiples increase by 20% and sells for 19.2x,
stock will be worth $768, a return of 20% annually. Conversely, if
multiples compress by 20% (12.8x), stock will be worth $512, an
annual return of 8.5%. In which case at 12.8x multiples, we will
add a lot more, because we view the lagging stock price as if the
stock is brisk-walking at that moment before it picks up steam to
jog and then sprint and ultimately, the full value will be
recognized. So if the stock brisk-walks while the value is
increasing at a faster clip than the stock appreciation suggests, we
will be there to catch more of it.
In
fact, I am late to the game for Mastercard and Visa because I was sucking my thumb for too long and held my trigger at least twice in the
past, particularly, during December of 2010 when both of their
prices plunged due to the Durbin Amendment.
- DirecTV
Comprises
about 3% of total assets. We got familiarize with DTV when Berkshire
announced the hiring of Ted Weschler in mid 2011. We first bought
DTV in September 2011 at $40.99 and then dispose the next month at
$47.2. Then in December 2011, we bought again at $42. And in May
2012, we accumulated a bit more at $45. Average price is $43.4.
Why
did we buy and accumulate more even at a price higher than the
initial price? For one, it is cheap and cash flow is predictable.
The other factor is the stock price has not kept up with the value,
i.e., compression in price-to-earnings and it was pretty sizable
one. Management targets for over $5 eps in 2013. Therefore, at
$43.4, it is less than 9x multiples for a business with highly
predictable cash generating capability.
Return
year to date is 12.5%.
- IBM
Makes
up about 8.5% of total assets. Bought between the range of $178 to
$198, at an average of $188.6. IBM revenue is much more predictable
than what it used to be. IBM, in essence, is very different from the
start of the decade. The transformation, owning to Lou Gerstner, has
been focused on shifting the business to higher value areas of the
market, improving operating leverage and investing in opportunities
to drive growth. IBM operates in four major segments: 1) Global
Services (GS); 2) Software; 3) Systems and Technology (ST); and 4)
Global Financing. Out of the 4 segments, 3 have got annuity-like
characteristics.
“Global
Services” which makes up 56% of total revenue, 44% of pre-tax
income. Approximately 60% of GS revenue is annuity based, coming
primarily from outsourcing and maintenance arrangements.
Software
revenue is approximately two-third annuity based, the remaining 1/3
relates to one-time charge arrangements for charges like license
fees, subscription, etc. Software comprises about 24% of revenue and
47% of pre-tax income.
The
role of Global Financing is to facilitates client's acquisition of
IBM systems, software and services. It is similar to a finance
company except that it has the benefit of both a deep knowledge of
its client base and a clear insight into the products and services
that are being financed. This allows Global Financing to effectively
manage two of the major risks – credit and residue value – that
are normally associated with financing. This segment of business is
very annuity-like and held up well as demonstrated in the table
below.

Global
finance has done well even during the financial turmoil of 2008/9
and has grown strong since.
In
terms of valuation, we paid 14x for 2011 adjusted earnings and 12.6x
for 2012. Management has a detailed roadmap on steering the company
towards achieving goals for both the longer term and also medium.
IBM aims to earn $20 adjusted earnings per share in 2015. If IBM is
priced at 12x 2015 earnings which is cheaper than today and also on
a historical basis, it is worth $240, a return of 6.5% annually. If
it is priced at 14x 2015 earnings, it is worth $280, an annual
return of slightly over 10%. If it is priced at 16x 2015 earnings,
it is worth $320, an annual return of 14%. Of course, if the
earnings surprise on the upside, the return will likely be much
more. Conversely, it can as well surprise on the downside. But IBM
has been conservative in its guidance for a long time ever since
Gerstner's days.
- Norfolk Southern Railway
Norfolk
comprises about 4% of total assets. The stake arises from the sale
of CSX Rail, for which we divested at a net gain of 12.5% and bought
into NSC. However, there isn't much difference economically owning
either CSX or Norfolk unless the price-to-value margin between them
greatly diverge. I'm indifferent to either CSX or Norfolk on their
fundamental business. Both are likely to perform step in step of
each other because both possess almost the same economic
characteristics.
Average
purchase price for Norfolk is about $73, a loss of 1.4% since
purchase. I admit I should have been better in timing the purchases
because right after the purchase, it fell to as low as $64, had I
not gave in to my lack of patience. Having said that, railroads even
at $73 should provide a decent value, though it can be a little more
volatile and cyclical. But overtime, rails are in a good position to
earn more than today in the 5, 10 or 15 years from today. Though in
now to then, there will be aberrations, especially on volume, but
not so much on unit price. In fact, rails have demonstrated their
pricing power as can be seen in the below table for the major
railroads:
 The
tables clearly demonstrate the strength of all of the rail
franchises on either side of the coasts through a full economic
cycle. The pricing power held up well even in the face of market
distortion in the years 2007 to 2009. Revenue per unit in 2009 is
7.7 to 10% more than 2007 for all the railroads even with unit
volume falling 20% from 2007. Moreover, total volume in 2011 was
still 10% less than its previous peak in 2006. Volume today is
around the same as it is in 2003. One of the “concerns” on
railroads, particularly the eastern railroads, was recently directed
at the decline in coal volume which is likely to be secular rather
than cyclical, as long as coal cannot compete with natural gas as a
fuel for energy. Just this week, Rex Tillerson, CEO of Exxon Mobil,
sort of admitted his mea culpa in going big into natural gas.
However, the decline in the coal franchise (over 40% of total
volume) is offset by growth in the overall merchandise businesses,
particularly very strong growth in vehicle/car carloads with year to
date volume growing in excess of 20%. In the latest weekly traffic
report from the Association of American Railroads, the total coal
carloads for year to date is down 10.8%, but the decline which
started since 2011, is levering off. In the week of 25, coal volume
is down only 0.4%. So any future decline in coal is bound to have a
much lesser impact to total volume, and may even be accretive to
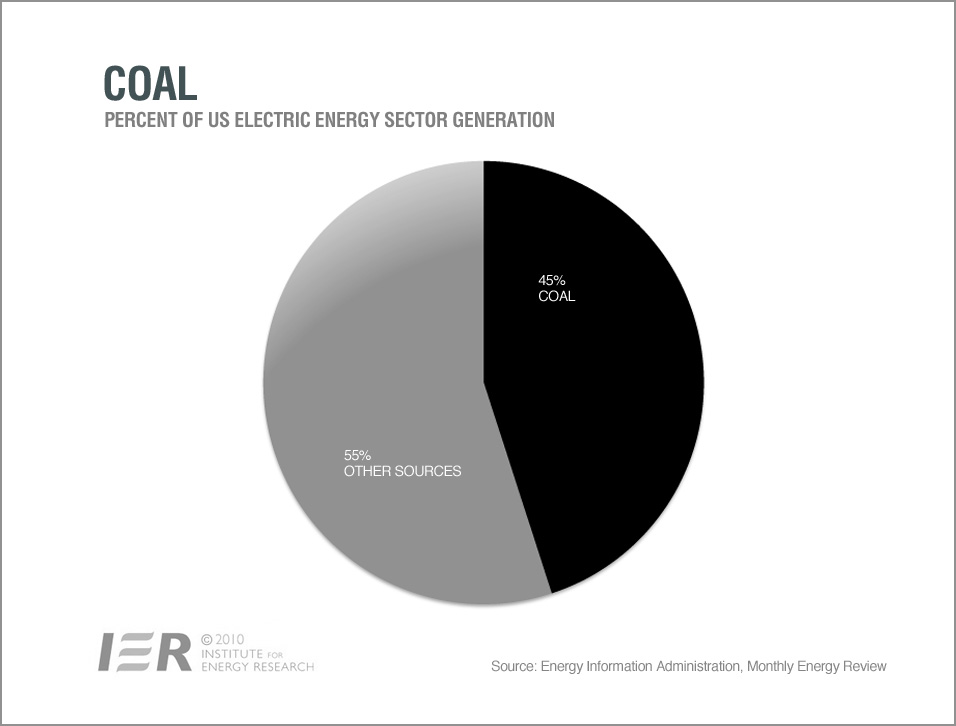
volume if there's an untick. Although utilities are using less coal,
coal is not going to go away totally, coal
makes up 45% of electric energy sector in the U.S in 2011, down from
49% in 2007. According to an outlook released in January 2012 by EIA, coal
is forecasted to generate 39% of all electricity generation over the next 25 years. Others are forecasting even lower - expecting coal to fall to 30% of all U.S electricity generation by 2020. Utilities are the major buyers of coal – buying more than 90% of coal mined in the U.S.
The
tables clearly demonstrate the strength of all of the rail
franchises on either side of the coasts through a full economic
cycle. The pricing power held up well even in the face of market
distortion in the years 2007 to 2009. Revenue per unit in 2009 is
7.7 to 10% more than 2007 for all the railroads even with unit
volume falling 20% from 2007. Moreover, total volume in 2011 was
still 10% less than its previous peak in 2006. Volume today is
around the same as it is in 2003. One of the “concerns” on
railroads, particularly the eastern railroads, was recently directed
at the decline in coal volume which is likely to be secular rather
than cyclical, as long as coal cannot compete with natural gas as a
fuel for energy. Just this week, Rex Tillerson, CEO of Exxon Mobil,
sort of admitted his mea culpa in going big into natural gas.
However, the decline in the coal franchise (over 40% of total
volume) is offset by growth in the overall merchandise businesses,
particularly very strong growth in vehicle/car carloads with year to
date volume growing in excess of 20%. In the latest weekly traffic
report from the Association of American Railroads, the total coal
carloads for year to date is down 10.8%, but the decline which
started since 2011, is levering off. In the week of 25, coal volume
is down only 0.4%. So any future decline in coal is bound to have a
much lesser impact to total volume, and may even be accretive to
volume if there's an untick. Although utilities are using less coal,
coal is not going to go away totally, coal
makes up 45% of electric energy sector in the U.S in 2011, down from
49% in 2007. According to an outlook released in January 2012 by EIA, coal
is forecasted to generate 39% of all electricity generation over the next 25 years. Others are forecasting even lower - expecting coal to fall to 30% of all U.S electricity generation by 2020. Utilities are the major buyers of coal – buying more than 90% of coal mined in the U.S.

Rail
volume has not really had much of a tailwind behind its back yet. In
fact, housing and construction is still not far from the the bottom,
though it is off the bottom. When housing construction recovers, you
can be sure the rails will be a lot more busy. In the meantime,
rails still have the leverage to price their revenue to get them
through till volume fully recovers.
To
drive home the point of the strength of the rails, the revenue per
unit increased between 68 to 85% and operating income per unit is up
255% to 1320% for the period 2002 to 2011. Although CSX operating
income per unit increased by 1320%, it was driven by a tremendous
improvement in operating ratio, compared to the rest. Had CSX
started with operating ratio of 80-82%, like the rest, CSX operating
income per unit would have grown at about the same rate as the
others – in the 250-280% range.
Now,
let's do some valuation on Norfolk. Based on estimated per share
earnings of $5.87 for 2012, the price we paid at $73 gives a PE of
12.5x, not an unreasonable value. With patience, this stock is
likely to work out fine in the end. Will volume ever recover to its
previous peak? The question is when. In the meantime, we wait. And
while we wait, the railroads are increasing prices at a clip over
rail inflation. Just recently, CSX posted on its website to
increase export metallurgical coal tariff rates by 4%. But rising rates can be
a double-edged sword, so they cannot be too unreasonable because
rails are still regulated by the Surface Transportation Board which
has the authority to reduce charges deemed “unreasonable” as
railroad operators can only levy charges that cover their operating
costs and a rate of return on assets. And it is common that
customers has frequently voiced their opinions.
To
understand how railroads get to where they are today, we will
provide some color here. Before 1980, railroads were regulated for
93 years and unable to set prices. With the advent of vehicles and
better connectivity of highway, competition was heightened for the
railroads. While railroads were regulated, truckers and waterways
operators were unregulated, and thus operated on a free market basis
which was a huge disadvantage for the railroads. By the 1970s,
railroads was on the brink of collapse. Bankruptcies were common,
earnings were too low to maintain tracks and equipments in good
condition,, and operating costs were rising. As a result, rails
infrastructure were in shambles and service level was atrocious. At
that time, nationalization was even considered. Eventually, it led
to the Staggers Act of 1980 which deregulated the industry.
Importantly, this act allows railroads to set prices that gives them
a chance to compete with truck and barge operators. Consequently,
railroads turned the table and were able to churn out profits that
would motivate them to reinvest in the business. This led to a
cumulative reinvestment of $480 billion since 1980. Today, railroads
infrastructure is healthy and service level is up year to year. This
has not only allowed railroads to prosper but have also contributed
greatly to the advance of the U.S economy. The railroad are
essentially the backbone for facilitating faster and more efficient
movement of goods, provided the proper infrastructure are in place
and are serviceable with a reliable service schedule and level. So
to re-regulate the rail industry would take a brave-heart to do so
unless the industry trips over themselves.
- Celgene
A
very small position bought for 15.5x adjusted 2012 earnings at $73.
Growth rate of 10-15%. Celgene is a biopharmaceutical with a few
commercial drugs manufactured and marketed by them. The main revenue
driver is Revlimid, a drug used for a type of blood cancer, Multiple
Myeloma(MM). In treating MM, there're basically three drugs, 2 of
which belongs to Celgene and the other, a subsidiary of Johnson and Johnson. Revlimid, along with the one by JNJ, are the two first-line
drugs used in treating MM. The other drug that has the potential to
attain blockbuster status in Celgene's fold is Abraxane, currently
only approved as a second-line treatment for metastatic breast
cancer. But there are a number of clinical trials (from early to
late stage) to study extended use of Abraxane in other areas of
oncology, for example, pancreatic. Celgene is hopeful Abraxane will
eventually be a major driver of revenue. However, I made a decision
buying Celgene in a haste. I would be better off had I exercise
patience again. But I still think Celgene provides a good likelihood
that I will be proven right because their existing commercial drugs
are running strong, and the pipeline should also provide some boost
in the future. And perhaps as a form of self-consolation, Celgene's
management is still targeting at least $8 adjusted earnings per
share in 2015. We shall see.
- Singapore and other stocks – M1, Singapore Land and Tesco (small positions)
- Bought M1 at S$2.42 early in the year. Received S$0.079 in the meanwhile as dividend and stock ended June 2012 at $2.56. M1 was bought along with Starhub at the same time, but Starhub has been sold in June 2012 at S$3.28, which appreciated from S$2.72.
- Singapore Land was bought at S$5.65 in Feb 2012 . Highly discounted from book value. Sells for a reasonable 10x cash flow. A majority amount of predictable revenue such as rental and hotel operations which can cushion the impact of the cyclical property development business. Excluding property development income, the predictable segments earns about S$0.50 to S$0.54, about 10.5 to 11x earnings multiple.
- Tesco is the giant UK retailer with international operations in Thailand, Malaysia and other parts of Asia and Europe. Bought Tesco in Jan 2012 at-the-then-3-or-5-year-lows at £3.155 per share or about 9x expected earnings. While we wait for the management to turn the UK retail business around, we get paid over 4% in dividend. Surely, a turnaround in retail is never a sure-thing. Just look at Carrefour, they even cut dividend. But in Tesco, we shall see. I believe fundamentally, they are not as bad as Carrefour. There's a reasonable chance for them. And that's why this is not a huge bet but a small one.
While
on the topic of a huge bet in a single or couple of positions, I have
not had one since late 2008 and early 2009. The last stock with more
than 20% in one position was Pepsico during 2011 but has since been
watered down to get into more favorable positions. Pepsico was
acquired for stability rather than an outright bet on a huge gain.
Now our largest position is in cash.
In
total, we hold 19 different equities – a record number we have ever
held at single time. Our top five positions of equities make up 54%
of all equities value (excluding cash). Our top seven positions
comprise 65% of all equities ex cash. Our seven largest positions are
Berkshire Hathaway, IBM, UOB, Mastercard, Pepsico, Coca Cola, and
Norfolk Southern, in the order of size. None of the positions account
for more than 10% of total assets including cash. However, three of
the positions accounts for more than 10% of equities value when cash
are excluded.
Compared
to where we started off, we had only 5 positions, with the top 2
positions making up 84% of all assets. Today is unlike the days when
we started off where bargains were abound. Some were selling for as
cheap as 20 cents on the dollar - for example, you can buy American
Express at $10 and now $57. If you dig a little more, there were even
10 cents on the dollar - for example, Liberty Interactive which was
available at $2 and now almost $18. The top 2 positions held then
were Wells Fargo and American Express. None of which we hold today.
When the market is in turmoil, it is easier to just concentrate your
positions in a couple of stocks because you don't need to worry on
risk as much as now.
Lastly,
divestures include Anheuser-Busch Inbev, Baxter, St. Jude Medical,
Starhub, CSX Railway, Molson Coors, Amgen, and SIA Engineering. We
only lost money on Molson Coors – a lost of 4.6% from what we pay,
but partially offset by dividends.
Mea-Culpa
Confession X 2
Deja
vu, this one is so reminiscent of what I did to Davita in the last
quarter of 2011. Of all the divestures for 2012, the only one I think
I made a mistake is Anheuser-Busch Inbev because it is a well-managed business with a first class CEO alongside a set of first-class
owners. It is a business that is focused on operational excellence and
provides a good growth rate (at least a high single digit growth). I
wish I know what I was thinking of when we sold BUD.
I
sold BUD at $64.6 early 2012 and regretted almost immediately when I
analyze in details. After that, it surges up. Then I bide for my
time. The stock hit a high of $74 over a month or so and then
gradually decline, and fell to slightly below $67. This is when I
committed a second mistake. Because I sold at $64.6, it became a drag
and anchor to buy again even though at $67, it was selling for 14.5x
2012 earnings, and much less for next. At this valuation, it will
likely provides a decent return. I told myself to buy at $67 but when
it fell below that, I kept thinking about $64.6. Only heaven knows
what I am thinking about. Now, the stock is even further from my
reach – last done at over $79. But well, I do not have to think
about them since the potential upside is pretty much lesser now and
not worth the risk to pursue.
You
can bet this will likely happen again because BUD case is not the
first time it happens. In fact, it is reminiscent to what I did for
Davita late last year. Davita was acquired for $63 in September 2011
and sold for $74 soon. Again, it was a mistake for failure to think
before selling. Then the stock only went up to a point of $90. Then I
bided for time hoping to repurchase again at a better price. About
two months ago, DVA announced a deal to acquired Healthcare Partners
which will be slightly accretive to earnings and purchase for a
reasonable price. The market did not react well to the news and price
fell to $78. At $78, it was selling at about the same multiple as
what I paid for in 2011. But I got anchored by the price I sold
earlier. Unfortunately, the price never came back down to $74. Now it
is over $95, way beyond my reach. Two deals which I clearly made the
same type of mistakes eerily follow a similar path in consequence.
What have I found out? Tying and anchoring yourself to the past and
basing a decision on other than facts is detrimental to one's
financial well-being which I have learnt but hopefully, will
practice.
Finally,
to close the letter, I recommend reading the book – Dethroning the
King: The Hostile Takeover of Anheuser-Busch.
NOTE: All currencies are in USD unless otherwise indicated. Returns are all measured in USD.
23 comments:
Hi Brian,
First of all, very nice blog. I especially like this post a lot.
I see a lot of you current holdings or your previous holdings are also holdings by Berkshire Hathaway (Coke, Wells Fargo, Amex, Norfolk Southern,DTV etc). Is this done on purpose to explore market inefficiencies (when Mr.Market is being irrational)on these already-proven-great-business-with-wide-moat? If so, I think it is a very intelligent strategy.
Do you mainly invest in large cap proven business or does your portfolio also entail small or mid cap stocks as well?
Thank you, Brian. I hope we can stay in touch.
Ning
Hi Ning,
Yes, a lot of what I held or still hold are what BRK holds as well. But I don't buy them just because BRK holds them. I buy them because I think it is provides good value.
If I don't know any Coke today, I would never buy them. The price that one pays for the value is very important.
For eg, today, Coke is valued at almost 19x 2012 non-gaap eps. Sure, at any price or value, a stock can still go up or down in any case. However, the question is how much risk is involved at the price you pay, the higher you pay, the more likely you are to lose and also the more likely your upside is lesser.
I bought Coke at two price ranges. The first time was in early 2010 when prices was in the low $50s, valued at 14.6x of adjusted eps for 2010. The second time was early this year at $67 when it was valued at about 16.4x this year adjusted eps.
At 19x eps, I rather pay for Mastercard or Visa whose growth rate is at least 50% more than KO for the next few years and who are selling for about the same multiples.
I invest in anything that is valuable. Actually, I prefer mid-size corporation, say anything above $2b to $20b. But ultimately, it is about value.
And for Amex and WFC, I will not buy them at today's price. Maybe Amex, I will cos it is less risky than WFC and still reasonably cheap. But I think there are better options than Amex at today's price which are less risky like MCD.
I bought AXP & WFC because there were damn cheap, especially AXP, in late 2008 to early 2009. I paid on average about $20 for Amex and $18 for WFC, although I was early cos the price fell by half after I bought. Gradually I sold both Amex ($42 to $50) and WFC ($26 to $34) in batches.
Sure, we can stay in touch.
Hi Brian,
Thanks for your prompt response. You did a very intelligent analysis. I definitely agree that great value did exist when you entered your aforementioned positions. I am very curious though, regarding your decision to dispose of Amex and WFC, especially regarding Amex. Is it because there are better opportunities for capital deployment or is it because by the time you sold Amex, it has reached your target price? This is just my personal opinion. Even at $50, Amex still appears to be undervalued and my rationale is as follows: (1) Amex's customers generally has good credit scores and hence Amex is less prone to catastrophic loan losses. (2) The U.S housing and job market is approving, albeit not galloping, which bodes well for Amex's credit card business(3) Amex has been repurchasing shares pretty consistently. (4) Based on what I see here in Atlanta and extrapolate to the U.S, business travelling has picked up quite a bit and a considerable amount of corporations use Amex for corporate travelling. At $50, or 12.5 X earnings and,1.5% dividend yield, it still appears attractive. Again, it's just my personal opinion.
Also, did you think that there were good value in Bank of America at $5 and JP Morgan Chase at $31? BoA clearly had floundered and faltered quite a bit during the past few years partly because overleverage and partly because it made some bad acquisitions, especially Countrywide. Brian Moynihan had done a quite remarkable job strengthening the balance sheet as well as getting BoA back to its core business. I thought the slump in share price of BoA was overdone by the market and initiated a position around $5.50 and added more to the position at $6.00. Now, with almost $60 cash per share and $20 book value per share, and a rought 8X 2013 estimated pretax earning,I still think it's a good value at $7.50 even though the current low interest rate environment will hurt the revenue side for quite a while and high mortgage repurchase claims.
As far as JPM, the recent trading loss scandal clearly induced some selling but I hardly think it warrants a almost 25% correction. Even though the trading loss is at the middle range of $4-5 billion, the impact on the per share earning is short term and with 3.6 billion shares outstanding ($1.1-$1.2 per share impact on current quarter's earning) , I don't think it was rational by the market to punish JPM by 25%. Now with less than 8 times 2011 earnings, $51 book value per share, and one of the best CEOs in Corporate America, I think it's still cheap. Earnings is coming out tomorrow morning and if shares sink as a result of larger than expected trading loss, I might add more to my position based on what Jamie Dimon will say at the conference call.
Please let me know what you think. Again, thank you for sharing your thought. I also went to the Berkshire meeting this year and took a picture in front of Buffett's house. I also see a good amount of overlap among the books we read. My favorite are Poor Charlie's Almanac and the Essays of Warren E. Buffett so far. Buffett's letters to both Berkshire Shareholders, the Buffett Partnership partners as well as other people's notes (especially Whitney Tilson's notes on BRK meetings and Wesco meetings)are also so enjoyable to read. Which of the books regarding value investing are your favorites?
I've already learned tremendously from reading your blog. As a juvenile wanna-be value investor, I really appreciate your generosity in sharing your wisdom.
Thanks again, Brian. Have a good one in Singapore!
Ning
Ning,
Are you based in Atlanta? Drink more coke:)
As to my sales for AXP, it still appears reasonable today. Anyway, my sales were all done prior to June 2011. Average sale price was much closer to $50 than $42 which was the price range sold for all AXP. And $50 was the peak for last year. I could have easily gotten it all back at low $40s when market was in turmoil.
The reason why I sold is as what I stated in the letter - either better opportunity or to derisk the portfolio in light of the overall economic situation. Indeed, after I sold, market went south, but in my opinion, not south enough, during Sep 2011.
Anyway, I did not buy back AXP, but indeed deploy some money in things like Davita, which was hit even more badly, when it fell to the low $60s; DirecTv at $40.6; BUD at mid $50s; Union Pacific at $83.6 (sold since), among others.
Without liquidity back then, i.e, without cash, I wouldn't have the opportunity to buy things as mentioned above because selling others, including AXP at that time, will not have gained you more, when you have to sell what you hold at depressed prices for something else that is also depressed.
Of course if one thinks AXP or whichever other shares are cheap, they can chose to invest 100%. But is it prudent given the overall economic risk out there? Would a market downturn not affect AXP even it is cheap at 12.5x?
Although the job market is still moving, and not that bad after all, but is the market price justified? And how about overall market risk? I just try to be prudent than to be foolhardy. I am willing to underperform if risk is higher than what the market suggests.
And it seems nothing is really solve in Europe. U.S Congress is still posturing over all the important things especially on deficit problem, healthcare and fiscal cliff. These are important issues for the long term.
The Central Bankers thinks using debt to solve a debt problem can sweep the problem away....what world are we living in?
So to me, I think risk is high and the general market isn't cheap which is a deadly cocktail. And when it adjusts back, most stocks will be affected including stocks that are also cheap. I will only swing for the fences if potential return is a lot higher than the risk involved, not the other way around.
And I am not saying AXP is expensive, I think it is reasonable but I just want to hold things that can hold up well or better in a Tsunami if it comes along. That was why I was highly in consumer staples and in cash most of 2011 which held up relatively well against the market turmoil. But you don't change to such positions only when you see the storm. You gotta be prepared way before the storm.
As for JPM and BAC, I am not very familiar with their numbers. On the surface, both appears cheap. I have no doubt Jamie Dimon is one of the best bankers out there and also one of the smartest guy. I read all his letters and it is so educational.
For JPM & BAC, both are cheaper than say USB, WFC or the regionals like PNC or BBT, probably because JPM, BAC & C are more than a retail bank. Retail bank have got earnings that are more predictable than a bank with an investment and trading arm.
So in order to value BAC, JPM & C, it's important to know their various sources of income and the makeup, amongst many other important things.
In fact, among these 3 banks, I may prefer C. C has got lots of deferred tax assets and they are selling also closer to the year low and probably cheaper than JPM. And as they continue to improve their operations, and making money, they can offset current and future taxes with the tax assets, i.e, Citi doesn't have to pay out cold hard cash. And if I remember, the tax assets is in tens of billions, probably enough to last them a decade or so.
I think BAC may also have significant deferred tax asset given the losses they took on Countrywide.
If I got to chose which bank to put money in, I will put in either JPM or C, rather than WFC or any of the regional banks. But I think I will chose C than JPM based on price and value.
As for books, my favorites are depending on the topic.
For investing fundamentals, I think the indispensable are 1) Intelligent Investor, 2) The most important thing by Howard Marks, 3) Delusion of a decade by Frank Martin, 4) Margin of Safety by Seth Klarman, 5) Winning the Loser's Game by Charles Ellis. In addition, read all BRK and Wesco letters, Howard Marks' memos, Frank Martin annual reports, anything written by Ray Dalio, Seth Klarman if you can lay your hands on their memo or annual letter.
But don't only focus on books that are just investing, because I think investing is alot more than just reading books on investing. Read up on all the books that depicts the story of successful or failure of an organization, and also biographies. I like reading books like Too Big to Fail; The smartest guy in the room; Sam Walton, etc.
If you wanna understand the history of credit cards, suggest you read "A Piece of the Action" by Joseph Nocera. It is one hell of a book.
If you wanna understand human mentality which investors are a subset of, read books like Influence by Robert Ciadini and books by James Montier.
Another important area for investing is accounting especially on tricks (tricks can be legal but it borders on the ethical line) and forgery. Books includes Quality of Earnings and Financial Shenanigans.
Brian
On hindsight, maybe I could have been better off if I held AXP. But in investing, mistakes are abound so it is part of the learning curve, I guess. Or better still, I should have bought back AXP at $42. Similar for WFC, I could have also bought it all back at a cost lower than I sold in the first half of 2011.
But well, I am thinking more on risk than anything else. And some of those value left behind on AXP is somewhat offset by new positions undertaken.
Assuming if I have left AXP, WFC and all other positions unchanged from 31 Dec 2010. Our record would be 5.3% more, i.e we would have $105.3 if we left our portfolio unchanged from Dec 2010 versus our actual portfolio of $100 today.
But in Dec 2010, we are 100% invested, and exposed to gyrations of the economy and thus the market. Today, we are in much less cyclical stocks and a much higher percentage in liquidity (30%) as of today, although we have 5.3% less had we stick to our Dec 2010 portfolio but then we were 100% invested and thus totally expose to risk and no ability to react. So we are happy to underperform while maintaining a decent risk profile.
Another thing to note about earnings. For example, JPM, although it looks cheap at 8x pe. The question is how reliable is the "e" in the equation.
If I remember correctly, market were expecting in excess of $5 a share in earnings late last year to early this year. So even at $45 which JPM was selling early this year, it isn't very expensive. But unfortunately, the "e" couldn't be relied upon. So investors who bought at $45 thinking JPM produces $5 a share in earnings is cheap, learned the lesson the old way.
The latest estimates of $4.2 as of yesterday was screwed again this morning when JPM revised the 1Q result, bringing it down to $4.1.
Of course, the lower the price goes, and the lower the earnings goes, it is a direction to where the risk is lesser and probably more reflective of the true earnings.
Hi Brian,
Thanks for sharing your favorite books by category. Incidentally I just finished reading Quality of Earnings and Financial Shenanigans a couple of days ago, both are great books. Just got the most important thing on my kindle this week and I've ordered winning the losers game, a piece of the action and the smartest guy in the room from Amazon this past Friday. Looking forward to devour those intellectual grains. Thanks again for your recommendation.
I assume that you listened to JPM's earnings call on Friday morning based on your facebook status, lol. I remember driving to work and hearing Mike Mayo asking Jamie Dimon Whether JPM as a whole, is reaching sort of tipping point when it comes to bigness or complexity that makes it more difficult to manage than in the past and Dimon just said "no." Then Mike's comment that you shared via Facebook came out and that comment really cracked me up.
Now I am definitely not an expert on the banking industry but I do have a passion in learning more about the industry. There are some items in JPM's "e" that strike me as "lower quality" such as the IB DVA gains, the expected full recovery of Bear Stern-related first loss note, and especially the reserve release related to loan losses. As of now I haven't gone through the earnings adjustment exercise to "look under the hoods" yet but I plan to do so soon. Meanwhile, if it's ok with you, would you mind sharing your thoughts on how do you analyze a bank such as WFC and JPM and what measures you use to get to the intrinsic value range if the "e" could not be relied upon?
I'm journeying through everything you wrote on your blog so far. It is so inspiring. I am very thankful for stumbling into your blog. Mistakes make us think and grow. I admire your assiduity, intelligence and persistence. Keep up the good work, Brian. No doubt you will achieve greatness that you fully deserve.
Hi Ning,
Can I ask you a question? Do you subscribe to Sirius XM radio in your car? Is Sirius XM commonly subscribed to in the U.S.? Is it possible to listen to Pandora in their cars?
I'm trying to evaluate Sirius XM as a stock. The company has improved tremendously since 2009 when it was close to bankruptcy.
And the prospect looks bright because it seems a lot of new cars are installed with a subscription to Sirius XM. And the annual new cars production in the US is on the upturn - at last count, was 13m annually I think which is still a way off from the previous peak of 16-17m.
Let me think and come back to share with you on the thoughts process I go thru for a bank. By the way, perhaps you may have seen Buffett's interview on both Bloomberg and CNBC. He has a million shares in JPM in his personal account and he is still as confident in JPM and Dimon as he was before, even before the scandal. So even without us looking under the hook, I think we can trust his judgment that JPM would not be a lousy investment. But of course, it will be better if we know what we are investing in and for and the value we are getting for the price we pay. Will come back on my thoughts on banking soon.
Investing is a long journey. When I look back at the things I wrote early in my blog, I find a lot of the things I wrote are amusing. That's why investing is an ever-learning journey and not a subject where a book or simply completing a degree or even masters will equip one for the future. Investing is just too wide to ever finish learning or stop learning. That's why it has captured my attention and interest. It's like playing a game where I learn and also get motivated. I hope you enjoy the journey as well. Just don't rush it through.
Hi Brian,
I happen to know Sirius XM because one of my co-workers was telling me about it the other day and he subscribed to Sirius XM (he has an Audi A6 Quattro). He's paying $12, or something in that neighborhood per month for the subscription. I don't subscribe to Sirius XM because I usually listen to NPR (National Public Radio) news, which is free.And you can listen to Pandora if you have the data plan and have access to 3G network here. I know quite a few people listen to Pandora, but not exactly sure whether they listen to it while driving.
Ning
Hi Ning,
Here's some of the things I think about when investing in a bank:
1) Pretax preprovision income
2) Nonperforming loans
3) Underwriting discipline and quality of loans
4) Predictability of revenue (business lines like asset management, mortgage banking, credit cards, lending operations are more predictable and less cyclical than investment banking, principle trading or securities trading)
5) Cost or interest paid on interest bearing liabilities
6) Net interest margin
7) Return on assets
8) Source of fundings (especially deposit base as a % of total assets or fundings); and if a bank is overly reliant on wholesale funding especially if economy is close or at the peak because wholesale funding can disappear as fast as it appears, thus, crimping banking operations and may expose a big funding hole.
10) Sources of revenue which can be related to predictability of revenue as well.
These are roughly the things I look out for in determining the quality of a banking. However, having said that, even if a bank comes in high in all these qualities, it doesn't necessarily means the bank is cheap to buy. It can be expensive or cheap. That is another matter altogether on valuation. Valuation is simply different from quality of business.
Anyway, I will try to write something on banking when I have the time.
Hi Brian,
Thanks for sharing your insights on how to value banks. I actually saw you had a post back in 2009 or 2010 on how to analyze a bank. So sorry for the repetitive request. I should've gone through all your posts first.
By the way, is the email you posted on facebook (dew_nay@hotmail.com) the one you use most frequently? I see this comment thread is getting pretty long. If you don't mind, can we exchange email address? I use jianing1112@gmail.com as my primary email account and I check it everyday. But if you prefer to communicate this way through your blog, I'm also up for it.
Ning
Yes, sure. We can communicate on email or FB. Much better that way.
Great post
very nice brian, waiting for next 6 month review
Excellent data on stocks on this site excellent coverage of companies.
My KLSE stock analysis portfolio is too strong from last three weeks, and following some strategies is my strength.
Post a Comment